Kuby - Kubernetes Log Viewer
Simplify Kubernetes log management with an intuitive, powerful viewer
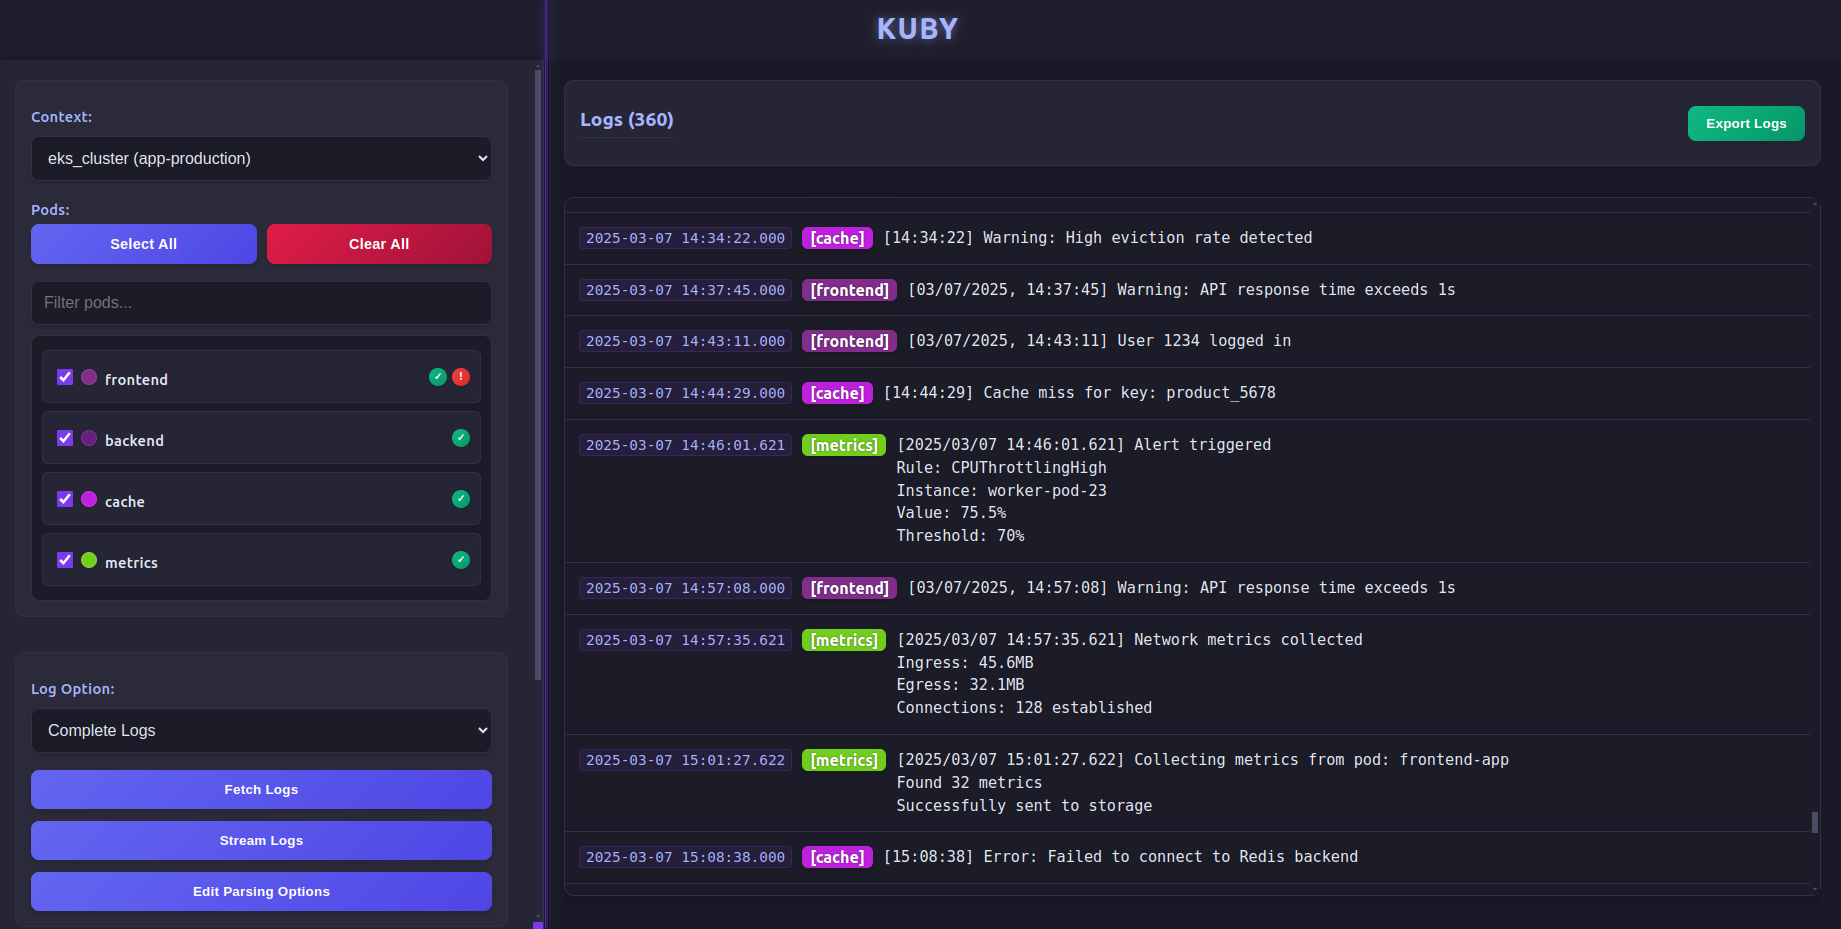
Simplify Kubernetes log management with an intuitive, powerful viewer

Select context, namespace, and pods through a clean interface. View complete logs or just the tail with a single click.
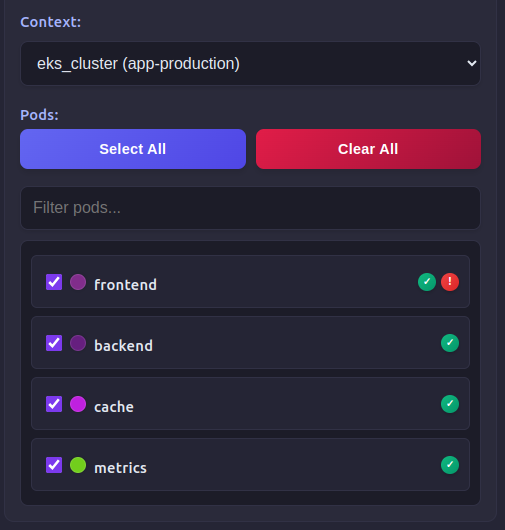
Watch logs update in real-time with WebSocket streaming. Auto-follow new entries or pause to examine specific areas.
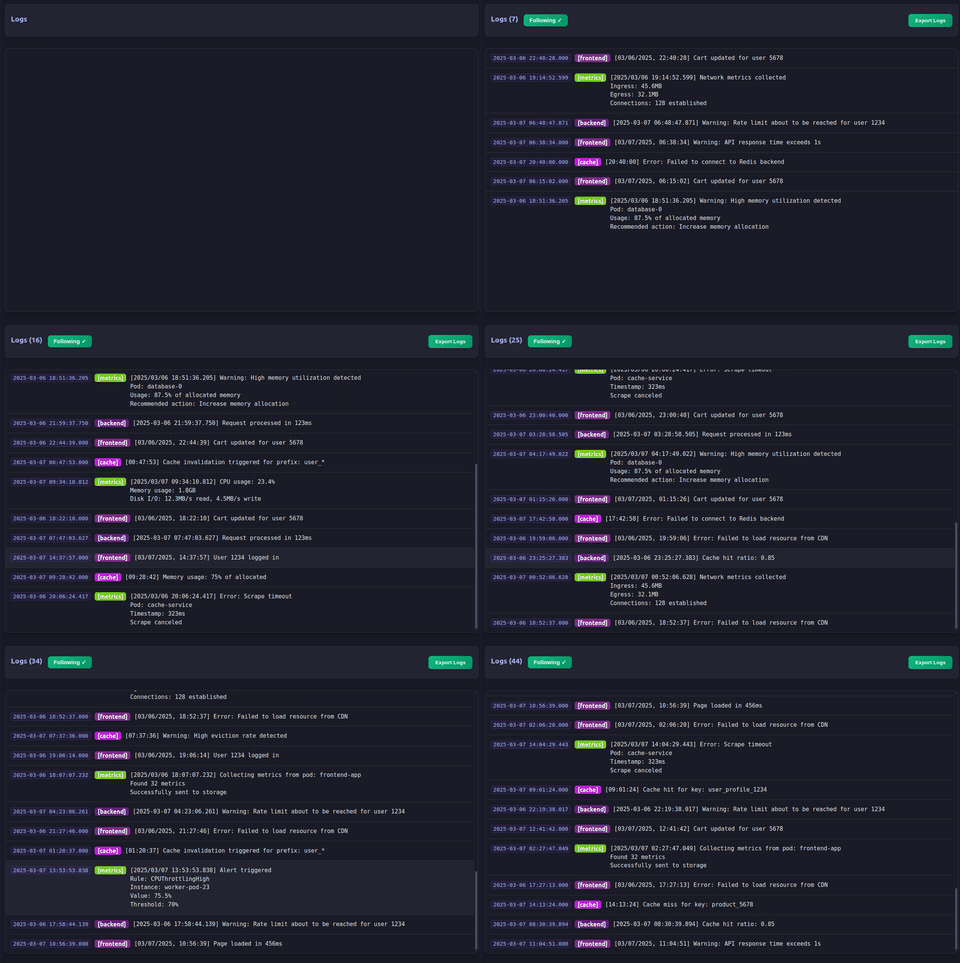
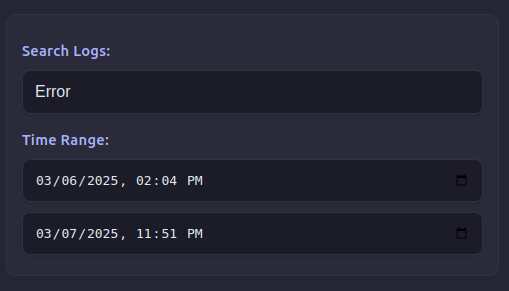
Find exactly what you need with text search and time range filtering. Color-coded logs make multi-pod analysis intuitive.
Choose context, namespace, and one or more pods
Complete logs, tail, or real-time streaming
Search text, filter by time, and analyze color-coded entries
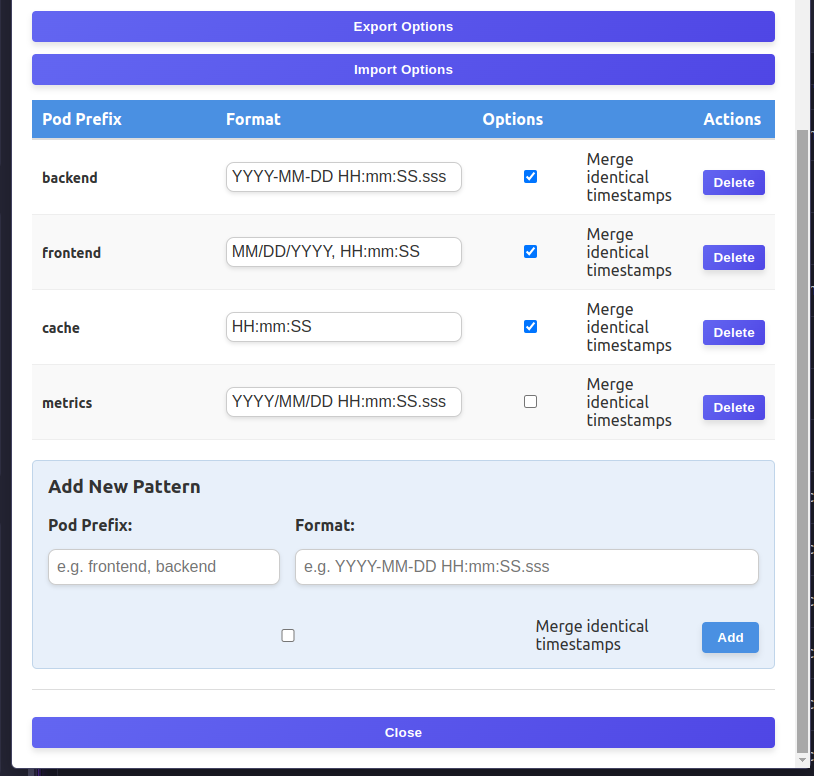
Adjust timestamp parsing for any log format
Every Kubernetes deployment uses different logging formats. Kuby adapts to your environment.
Kuby runs locally and connects directly to your kubectl configuration.
npm i -g kubyKuby will automatically open in your browser and discover your Kubernetes contexts.
Debug your application by watching logs from multiple microservices simultaneously. Color-coding helps track request flows across services.
Quickly investigate issues by accessing logs from multiple pods. Filter by time ranges to focus on the exact moment a problem occurred.
Export and share parsing configurations with your team to ensure everyone can effectively analyze logs with the same view.